Our company is interested in exporting our products. What data sources are available and how can we evaluate our prospects?
The U.S. Census Bureau has a wealth of information for evaluating both domestic and international markets. In this series of blog articles, I’ve documented the methods for retrieving Census export data and analyzing it in Power BI. Topics include: the product classifications used by the Census, the mechanics for retrieval and how Power BI and the Tabular data model can make quick work of a 5 million row data set.
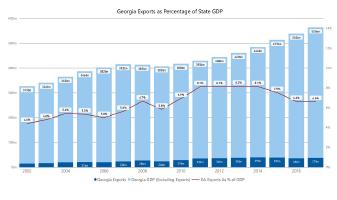
Viewed in aggregate, you can see that exports have an important and growing role in our state’s economy (graph below.) That data really comes alive when you can drill down and explore data trends in your own industry.
Article Index:
- USA Trade Online: Introductory article describing Census Export data. The accompanying video walks you through retrieving data in Excel format. Useful for casual consumers of Census data and to help orient you to what data is available.
- Trade Data via the Census API and SSIS: This explains advanced retrieval methods that are needed for bulk-retrieval of Census data. At this stage we are creating a more comprehensive database. We are automating the method used to retrieve the data on a recurring basis (ie., monthly).
- Georgia Exports in Power BI: Demonstration of a Power BI interface to summarize and visualize the 5 years of Census data retrieved. We learn what countries purchased Georgia goods and the manner they were delivered. Data is available as annual totals (2013-2018) for the state of Georgia. The model allows you to drill-down into the Harmonized Code system up to 6-digits.
- Change over time analysis using Power BI: This is an evolution of our original Power BI model that helps identify trends over time. Pick any two time periods, and the model shows total sales trends and what countries are responsible for the change.