Export goods originating from Georgia reached an all-time high-mark of $39.4 billion in 2014. As a state, Georgia has been trying to exceed that banner year ever since. Recent talk of tariffs and revisions to NAFTA have caused many Georgians to wonder what effect this may have on our economy. We will have to wait until February 2019 for the US Census Bureau to publish complete 2018 export totals. But currently available data can help us understand the role that exports have in Georgia’s economy and what countries dominate as our trade partners.
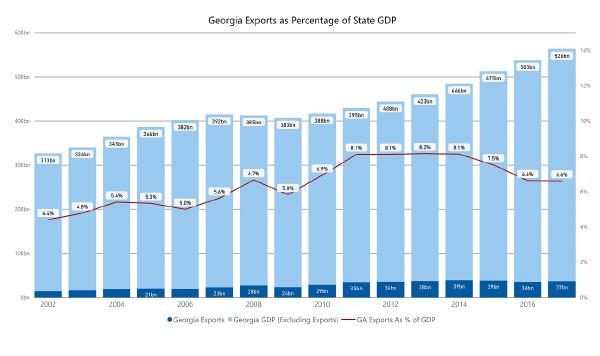
In 2017, Georgia’s export economy was the 12th largest of the 50 states. Over 15 years’ time, the dollar-value of goods originating from Georgia and sold abroad has grown 2.5 times. In 2002 exports totaled $14.4 billion. By 2017 they had grown to $37.2 billion.
During this time, our overall state economy grew as well. This is typically measured as gross domestic product (GDP). We can gauge the relative importance of exports to our total economy by expressing exports as a percentage of GDP. Georgia exports have risen from 4.4% of GDP in 2002 to a peak of 8.2% in 2013. Since 2015 this percentage of exports to GDP has moderated towards 6.6% (see bar graph).
Be Nice to Your NAFTA Neighbors #
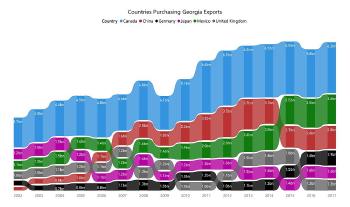
There were 215 different countries purchasing exports from Georgia in 2017. On one extreme is Liechtenstein with a 2017 total of $2998.00 for aircraft parts. On the other extreme is Canada that purchased over $6.2 billion in 2017.
Among Georgia trading partners, Canada is in a league of its own. Over the past 15 years (2002-2017), Canada has purchased a total of 84 billion of goods originating from Georgia. For comparison, over this same period China purchased a total of $33.4B, Mexico $33.3B and Japan $21.0B. For each year in 2002-2015, Canada has purchased more than the combined total of our next 2 (and often 3) largest foreign customers (see ribbon graph).
At the time of writing we only have the first 10 months of 2018 export data from the Census Bureau. As we continue our look at trading partners, we will report the actual 10-month totals for 2018, as well as extrapolated values for the full year.
Mexico has grown steadily as a trade partner, more than tripling the total exports purchased from $1.1B in 2002 to $3.6B in 2017. Mexico’s 2018 actual 10-month total is $3.3B, with a projected record high of $3.9B for the entire year.
In 2002 China recorded $415M in Georgia purchases. This grew 9-fold to $3.7B in 2013. Since that time it has leveled off around $2.7B. China’s 2018 10-month total is $2.6B with a $3.1B extrapolated prediction for all months in 2018.
$1 Billion Club #
Japan, United Kingdom, Germany and Singapore have purchased at least $1B a year from our state since 2002. But among that group there is a country that deserves special mention. Germany has been edging consistently upwards in purchases over the past few years. That includes a 22% increase ($238M) in 2014, an 11% increase ($149M) in 2015, a 7% increase ($103M) in 2016, and a 17% increase ($267M) in 2017. With only 10 months of 2018 transaction data, they have already exceeded their 2017 year totals. They are on track to post an increase of some 17% ($330M) in 2018.
Waiting on the Data - Will we top $40 Billion? #
Economists have speculated that the threat of tariffs has prompted early purchases of goods in 2018. If that is true, it may inflate our estimates for sales in the remaining two months of 2018. But if November and December rates match the first 10 months of this year, Georgia appears likely to beat the 2014 record. For the first time the export portion of Georgia’s economy may exceed $40B.
End Note: The Census department was scheduled to publish November 2018 figures on January 8, 2019. Due to the Government shutdown, all Census data publications of this sort have stopped. Their normal release schedule would provide full 2018 data on February 5, 2019. Whenever that data is ultimately published, I’ll confirm the Georgia export totals on this blog.