
DAT204 - Intro to R for Data Science

·433 words·3 mins
Table of Contents
MPPDS - This article is part of a series.
Part 6: This Article

As a developer, I’m drawn to terse/concise languages that are purpose-built for an objective. Regular expressions are a prime example. There is something beautiful about expressing things in few words (something I try to do in blogging with only partial success!) In this context, I was eagerly anticipating “Intro to R for Data Science.” This course (and this language) did not disappoint.

Before going further, I should note something: Within the Microsoft Professional Program for Data Science, it is the student’s discretion to take a Python or an R track. Your decision will be shaped by whether you have prior familiarity with one of those environments, and whether you want to reinforce what you already know or venture into a new tool. Your choice of this class will logically dictate the 2nd “advanced” course required later in the MPP track.

Intro to R for Data Science
#

RIntro_Wiki.gif

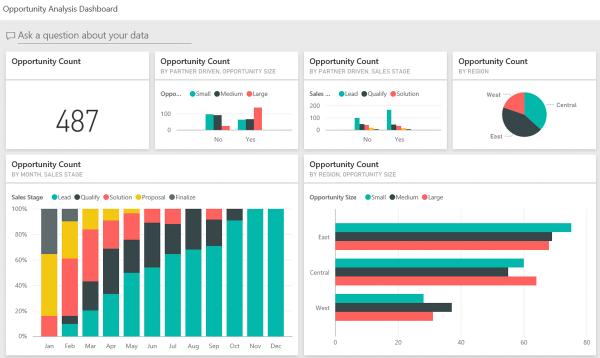
The course lays the foundation of data types, vectors, matrices, factors, lists and data frames. It then briefly describes the graphics capabilities of R. Those most fundamental issues about a language are covered early. The presenter does a great job of progressively walking thru topics.

In order to get meaning from each of these courses, I write detailed notes in our Atlassian Confluence wiki. That includes grabbing relevant screenshots of the video. Provided below is an example of notes taken about R Data Frames. Taking these courses in succession like I’ve done demands this sort of note-taking. This Confluence wiki is my fully searchable 2nd brain on occasion of applying these skills down the road. Due to the volume of information coming at you in these classes, I’d strongly recommend some comparable note-taking habit.

On this particular course, the author provides 16 PDF handouts with the slides for each video. This is the first class in the MPP sequence to offer this, and are a useful resource for those taking this course.

The course presenter “Philip” is undoubtedly the best presenter to this point in the MPP sequence. He is enthusiastic and works from a carefully written and delivered script. The class is composed of 16 videos with a total running time of about 100 minutes.

featured.gif

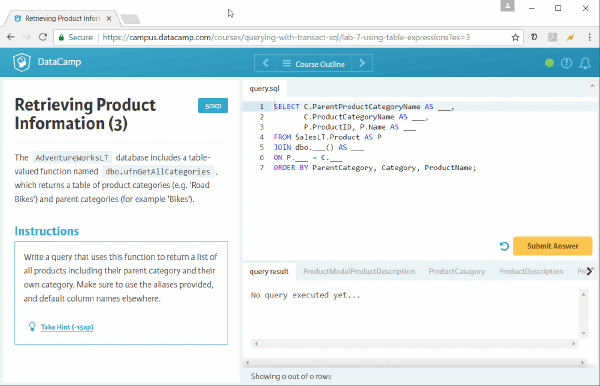
The course makes use of a DataCamp learning environment – which is an online IDE simulator that walks you through a guided lab to test your comprehension. It is simple to learn and worked without a glitch. Though not mandatory, I’d recommend the installation of RStudio to experiment offline with the language.

There are a reasonable number of concepts presented. In total, it required 20 hours to complete the course. 

Jonathan Bartleson
Author
Jonathan Bartleson
MPPDS - This article is part of a series.
Part 6: This Article

Related

DAT222x - Essential Statistics for Data Analysis using Excel

·545 words·3 mins
Call me a nerd, but statistics are fascinating and useful. I’d had quite a bit of course-work years ago in school, and was looking forward to “Essential Statistics for Data Analysis using Excel” as a refresher course. Unfortunately, the experience of this edX course might be tag-lined “Sadistics.” Completing this was a painful experience. I hope the notes here will make the experience a bit more tolerable for others. Essential Statistics for Data Analysis using Excel # There is a huge amount of content being presented. In terms of coverage, it is worthy of a full semester college course in statistics.

DAT207x - Analyzing and Visualizing Data with PowerBI

·230 words·2 mins
The course “Analyzing and Visualizing Data with PowerBI” is devoted to showing the capabilities of this Microsoft tool. For those who have worked previously with Excel, Microsoft Access or SQL Server Reporting Services – the video demonstration of PowerBI capabilities will cause you to repeatedly think “wow – that is slick.” As an example, pictured below is one of the dashboards created as part of the course. Analyzing and Visualizing Data with PowerBI # The course is composed of approximately 120 videos whose duration varies from 1-5 minutes. There are 4 different people presenting and the video content is quite good. The pace of content is well measured and the videos nicely support the lab materials. This is a really enjoyable course outlining capabilities of an innovative tool.

DAT201 - Querying with Transact-SQL

·643 words·4 mins
Following the breezy orientation course, the Microsoft Professional Program for Data Science curriculum digs into the Microsoft dialect of SQL known as Transact-SQL. This course briefly addresses updating data, stored procedures, transactions and error handling – but the bulk of the course concerns extracting data from SQL Server. This is the 2nd in a 10-part online course sequence for which I’m documenting my experience for others. The course title is “DAT201x: Querying with Transact-SQL” Querying with Transact-SQL # Transact-SQL gives you a lot of dexterity for pulling out data and the video series covers these topics comprehensively if not very deeply. All standard features of SELECT (where, group by, having clauses) but also topics like joins/intersect/except, correlated sub-queries, common-table expressions, grouping sets, and rollup/cube topics are included.