The course “Analyzing and Visualizing Data with PowerBI” is devoted to showing the capabilities of this Microsoft tool. For those who have worked previously with Excel, Microsoft Access or SQL Server Reporting Services – the video demonstration of PowerBI capabilities will cause you to repeatedly think “wow – that is slick.” As an example, pictured below is one of the dashboards created as part of the course.
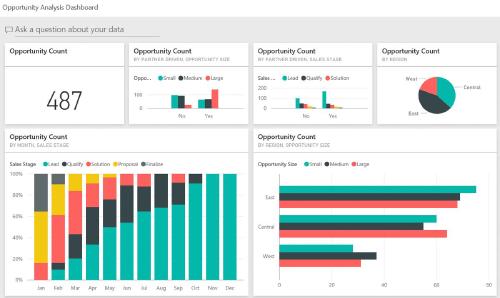
Analyzing and Visualizing Data with PowerBI #
The course is composed of approximately 120 videos whose duration varies from 1-5 minutes. There are 4 different people presenting and the video content is quite good. The pace of content is well measured and the videos nicely support the lab materials. This is a really enjoyable course outlining capabilities of an innovative tool.

A summary of topics covered is available via this link in the edX site. In terms of course credit, 65% is determined by completion of the labs, 30% for quizzes, and a stray 5% for completing a survey. All told, I spent 22 hours viewing the videos, doing some outside reading, and completing the labs and quizzes.
If you are interested learning more about PowerBI, I would encourage two supplements to topics covered in this course:
- Teo Lachev’s book titled “Applied Microsoft Power BI”, 2nd edition published 2017, and
- “The Definitive Guide to DAX” (co-authored by Marco Russo and Alberto Ferrari, 2015).